Ferry ridership reporting system
Passenger and bike counts from the vessel bridge to operations dashboards, automated reports, and public data.

Captains, dispatchers, agency staff, planners, and the public
User research & interface design · Application & database development · Offline data entry · Dashboards & data visualization · Automated reports & notifications · Staff training
Captains, dispatchers, agency staff, planners, and the public
User research & interface design · Application & database development · Offline data entry · Dashboards & data visualization · Automated reports & notifications · Staff training
Project overview
The challenge
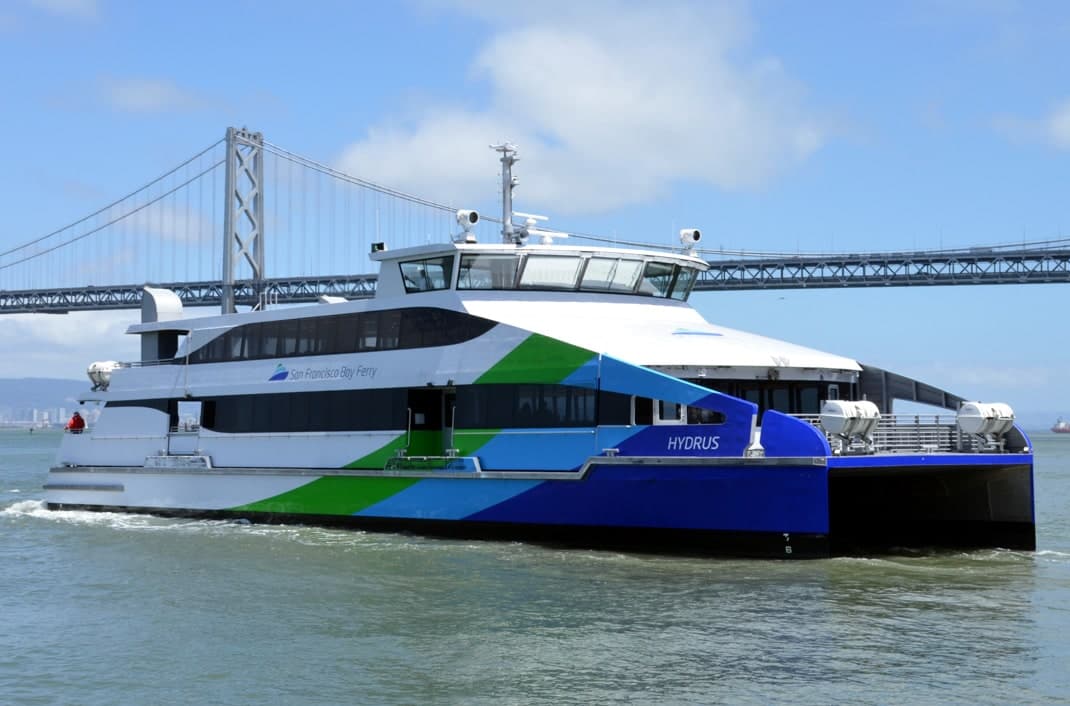
San Francisco Bay Ferry records all passenger counts manually as people board. A crew member relays the counts to the captain, who enters them on a laptop on the bridge. The system needs to support that workflow even when cell service drops in the middle of the bay, while giving operations staff and planners the data they need.
Our work
BlinkTag built the end-to-end ridership reporting system, from real-time passenger and bike count entry to onboard passenger views, internal dashboards, data review, automated reporting, and a public-facing ridership dashboard.
The result
Captains and dispatchers can record counts, operations can see how many passengers are actively onboard, and staff can review and finalize data for reporting. The public can explore ridership and bike boardings over custom date ranges and download aggregate data.
Built around work onboard
Passenger and bike counts are entered in real time. The entry workflow is designed to work offline during gaps in cell service on the bay. A separate view shows how many passengers are actively onboard.
We worked closely with San Francisco Bay Ferry staff, operators, dispatchers, captains, and planners to understand their needs. We made iterative changes to the recording interface and trained staff on best practices for recording data.
From daily counts to reviewed reports
The internal dashboard tracks passenger and bike counts across routes, dates, and directions, with raw data exports for further analysis. Automated email reports deliver ridership information, and notifications alert staff when data issues occur.
A data review and finalization pipeline supports the work of checking records and preparing them for reporting.
Public access to ridership data
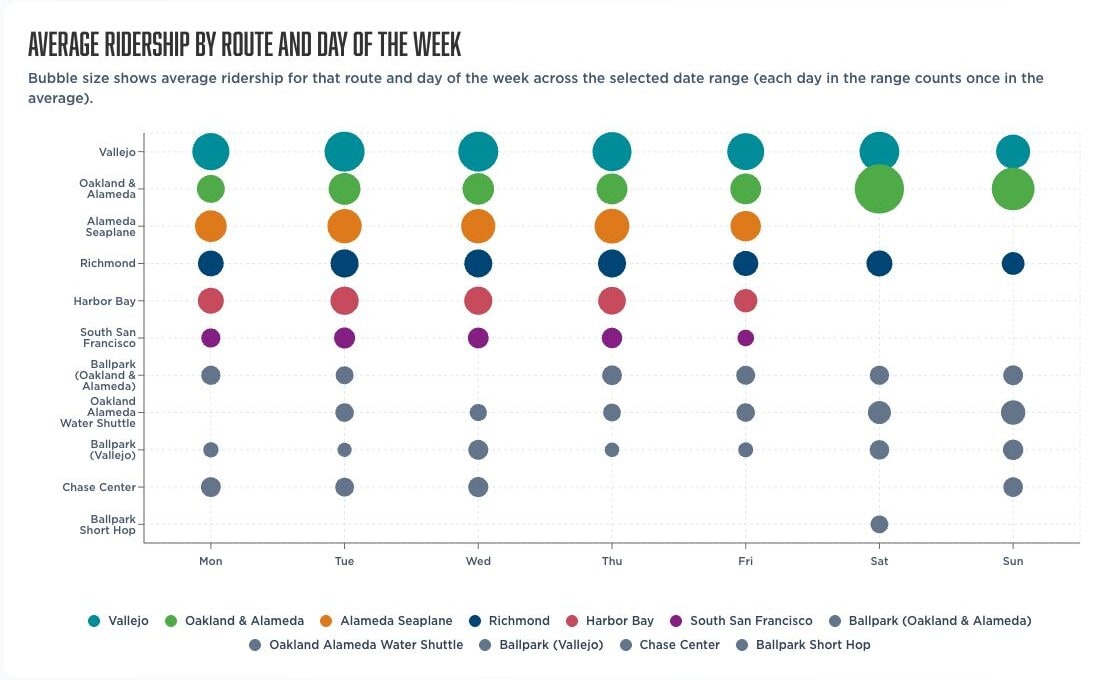
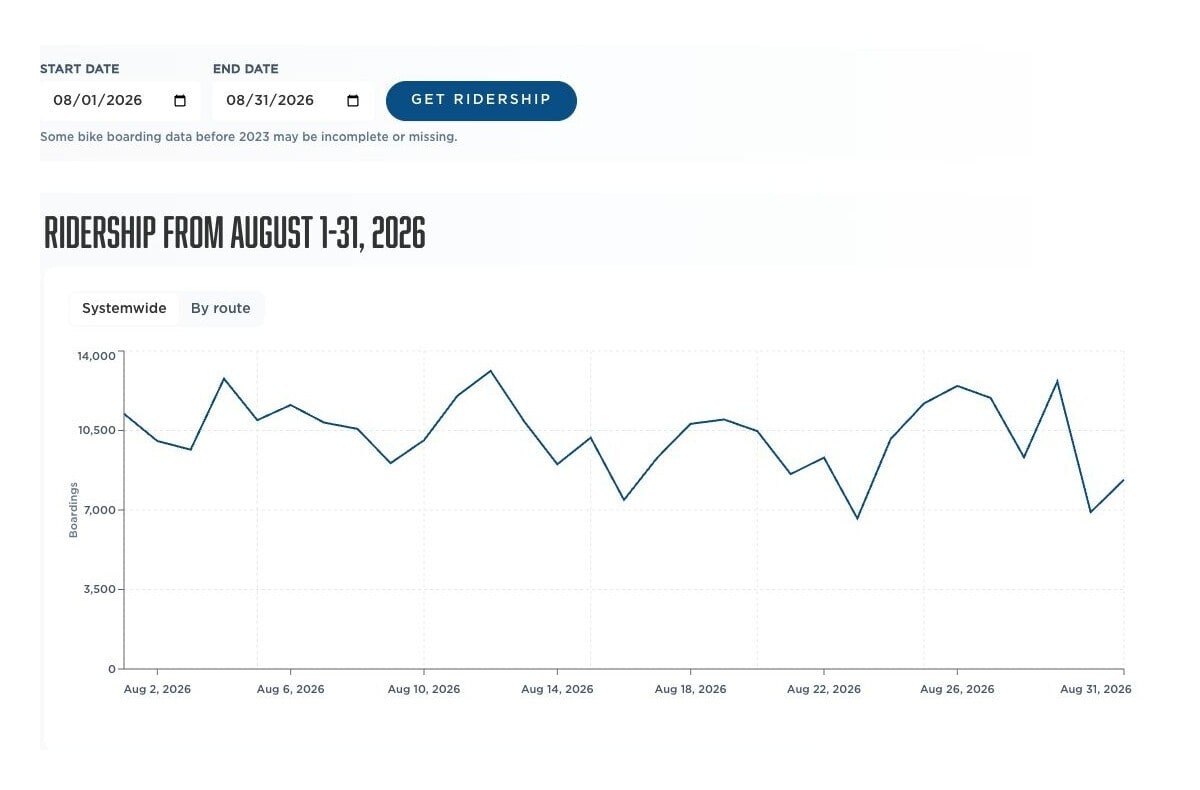
A public ridership dashboard is available on the San Francisco Bay Ferry website. Visitors can query any date range within the available data, explore systemwide and route-level ridership trends, compare average ridership by route and day of the week, and view bike boarding counts.
Data people can use
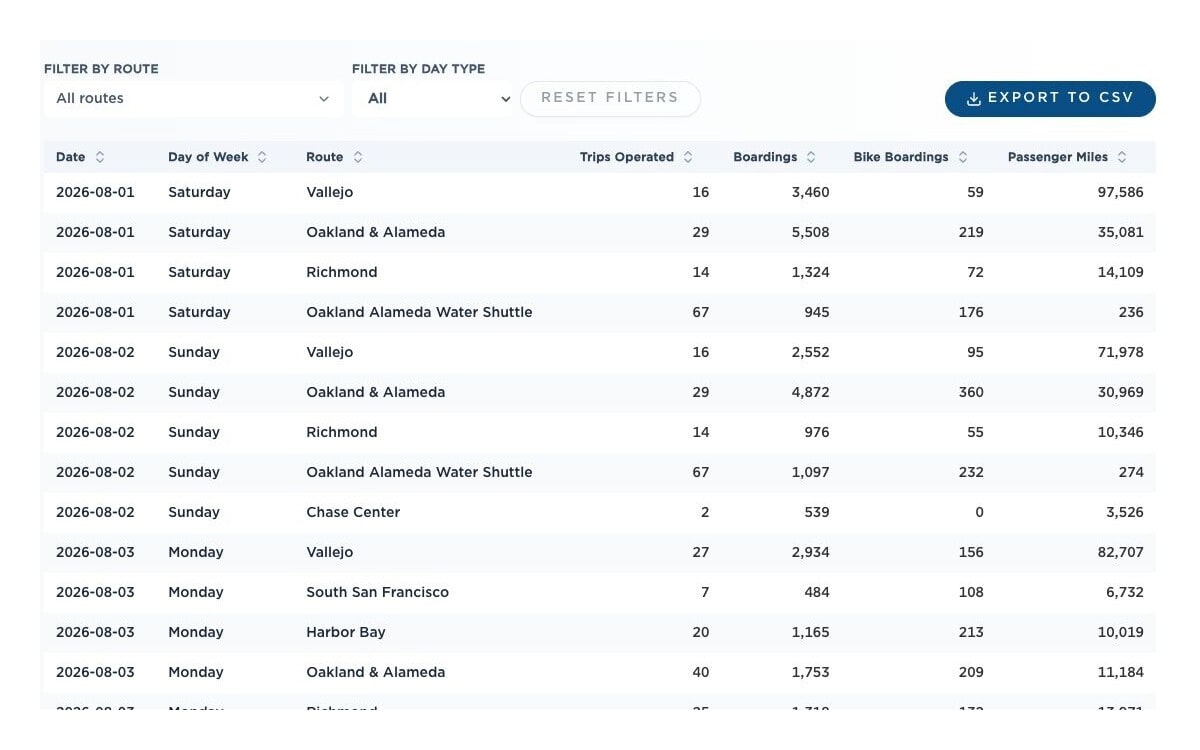
The public table includes passenger boardings, bike boardings, trips operated, and passenger miles by route and date. Visitors can filter by route and day type, sort the results, and export aggregate data to CSV for their own analysis.
Related projects
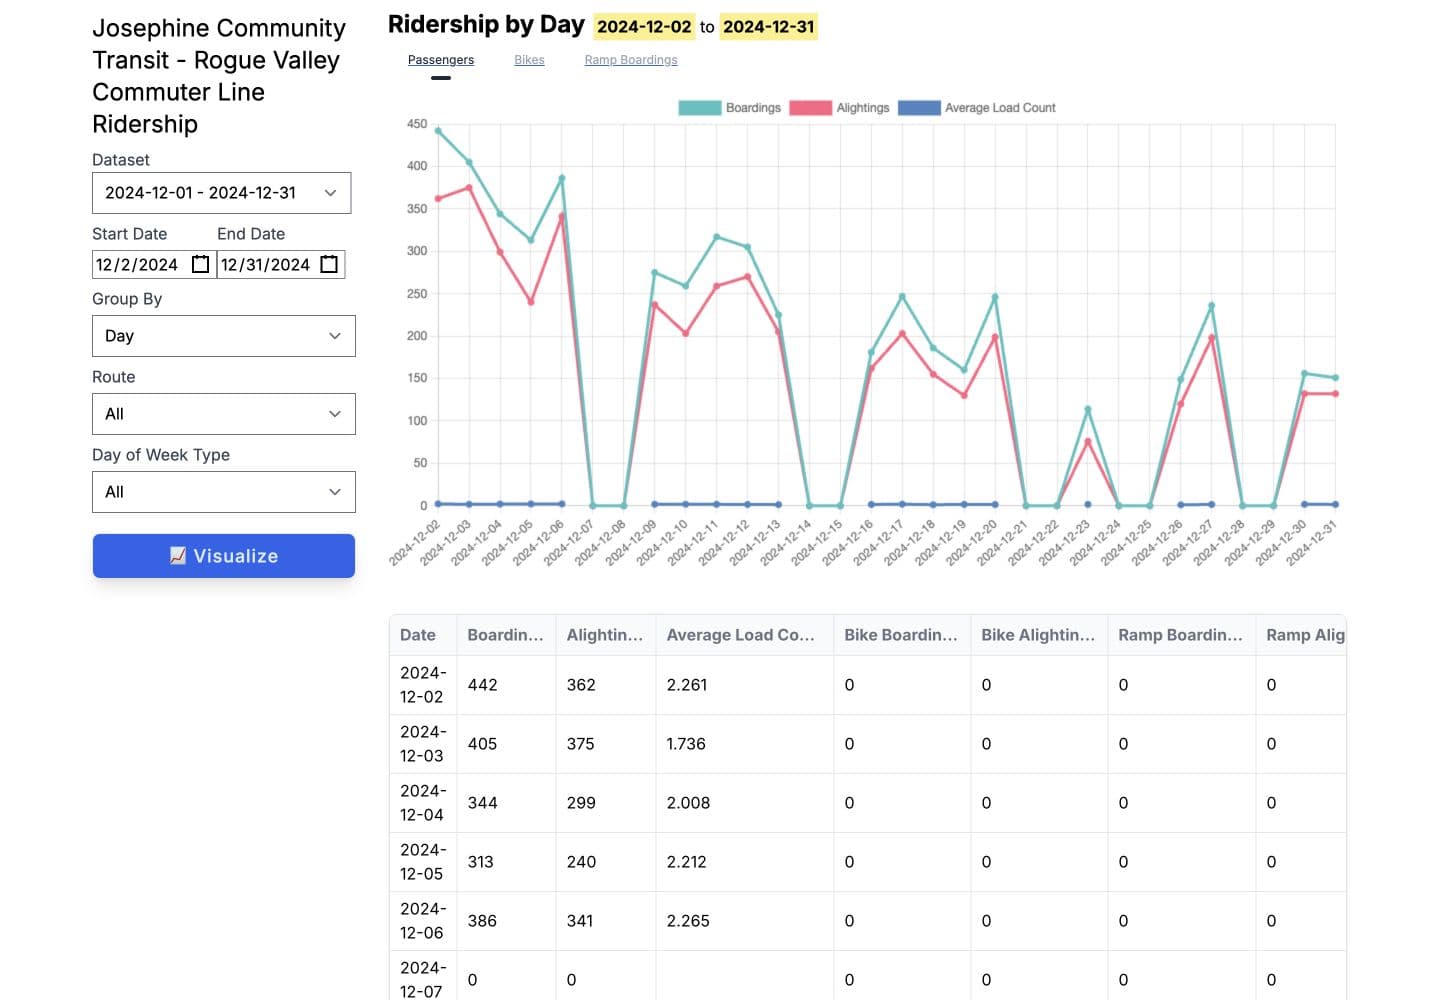
GTFS-ride: ridership data tools and publishing
A ridership-data website, conversion tools, and visualization app developed with Oregon State University.
Data & operationsMaps & decision toolsWebsites & digital publications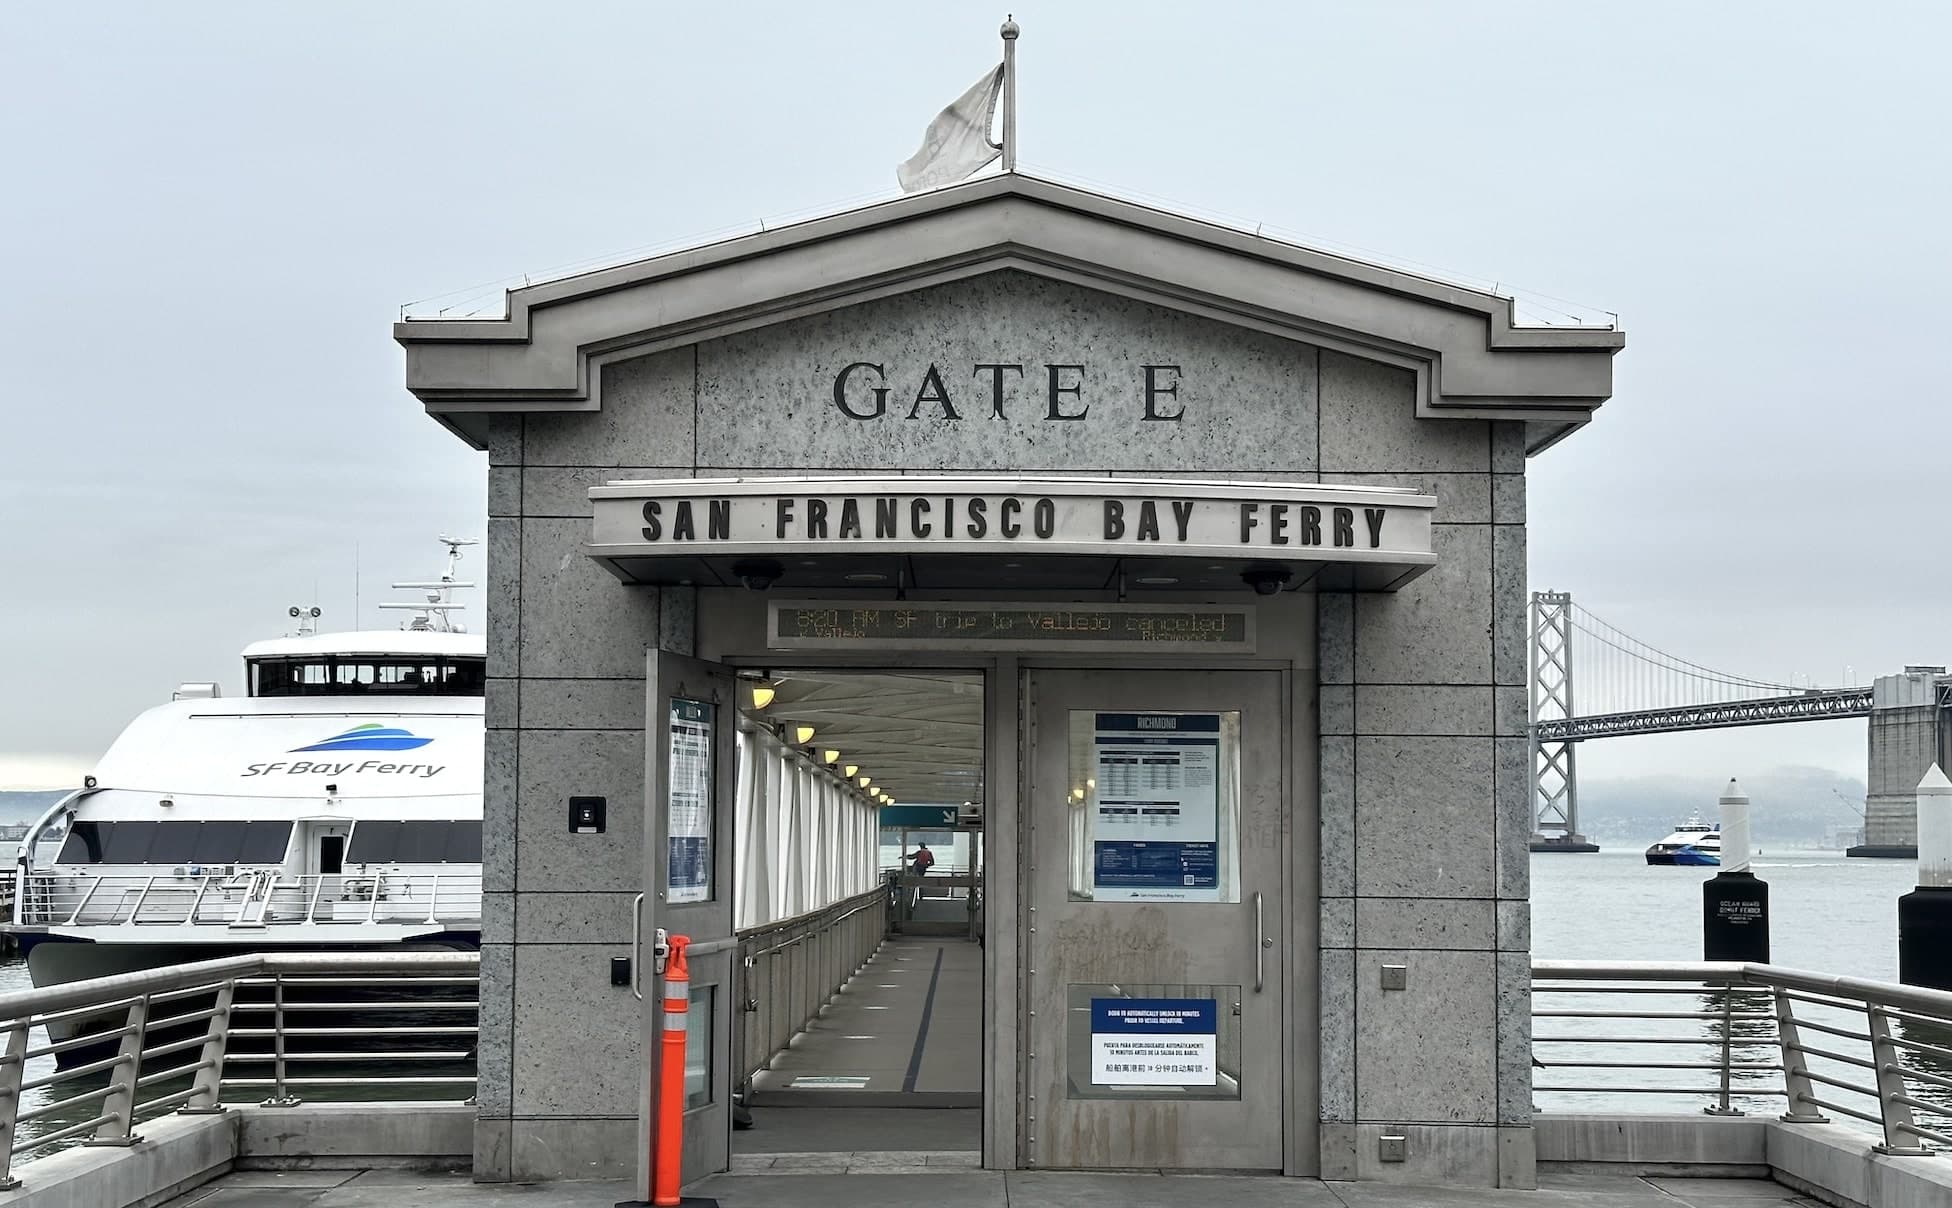
Real-time ferry departure signs
Schedules, arrival predictions, and service alerts for ferry terminals.
Transit & rider toolsData & operationsPlanning a similar project?
Tell us about your requirements and the people who will use the system.